Introduction
Introduction
The release of the major annual versions of the AxesSim software provides the backdrop for the presentation of realistic modeling whose aim is to give an overview of the new features added to the tools during the year of development.
Among these new features, there is AXS-SAR, the AxesSim solution for calculating SAR (Specific Absorption Rate). This solution is used within the framework of the use of the 62704 standards, more precisely the 62704-1 and 62704-3 standards. These standards cover in depth the calculation of DAS using the finite difference method in the time domain.
The modelling presented in this document is based on the validation case of standard 62704-1 called «Setup for system performance check». This is the modeling of the performance verification method of the SAR measurement system. A SAR measurement dipole is placed under a dielectric block, all the dimensions and physical characteristics of the materials being known and controlled, the correct value of the input impedance of the dipole determines if the measurement system is «valid» for a measurement campaign.
Futhermore standard 62704-1 also highlights the use of non-uniform grids. The use of these non-uniform grids saves memory space and calculation time.
This study has allowed the presentation and the handling of the definition of the notion of a non-uniform grid in MaxSim. It has also allowed to demonstrate the conformity of the AXS-SAR calculation solution with standard 62704.
Setup for system performance check
It is a dipole positioned under a thin dielectric shell (Phantom shell) and a large dielectric block (Tissue simulant). The operating diagram of the system is shown in the following figure :
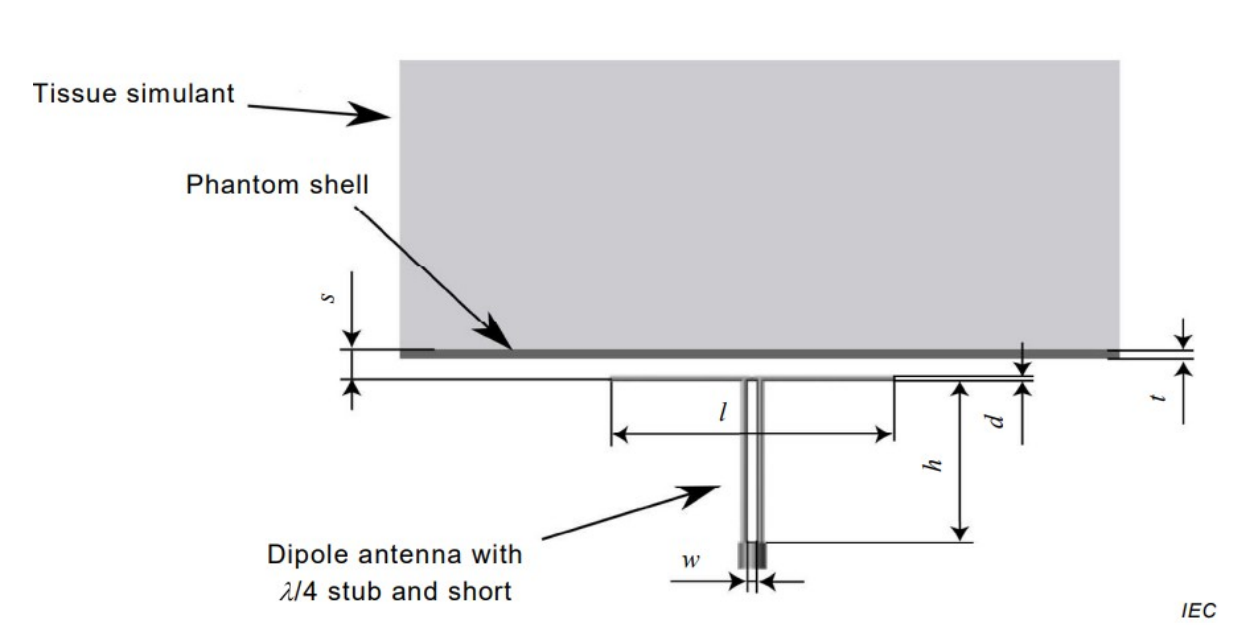
This dipole configuration and tissue simulant for system performance control is defined in IEC 62209-1 and IEE Std 1528. The thin plate represents the shell of the phone and the dielectric block represents a piece of human tissue. When radiating, the antenna first passes through the shell of the phone before reaching the human body.
It must be simulated at 900 MHz which constitutes one of the GSM (Global System for Mobile Communications) operating bands in Europe.
The tools used are:
CAD creation in FreeCAD (Design)
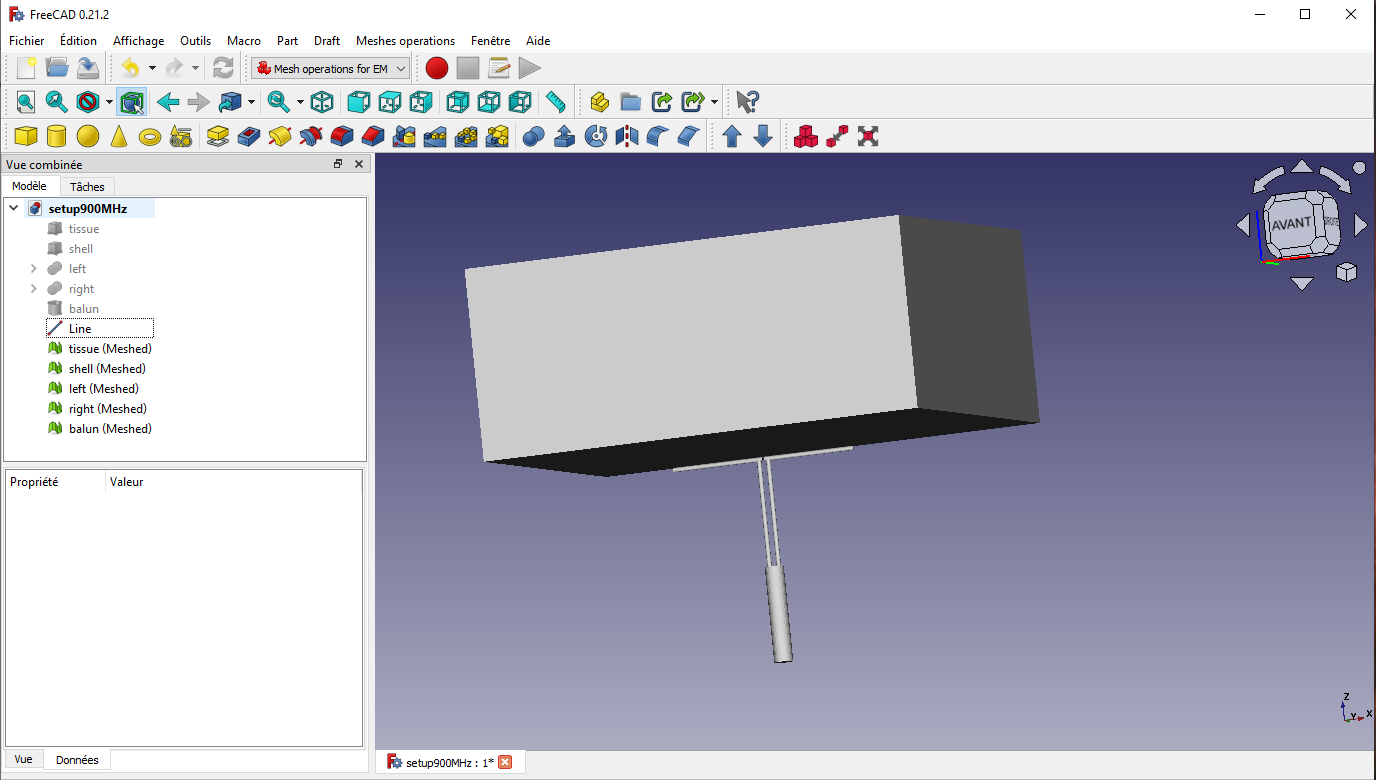
The «setup for system performance check» system is modeled in FreeCAD. FreeCAD can export «Setup for system performance check» geometry to MaxSim. The following figure shows CAD in FreeCAD.
Mesh generation in MaxSim:
The design stage led to the CAD above which was important into MaxSim.
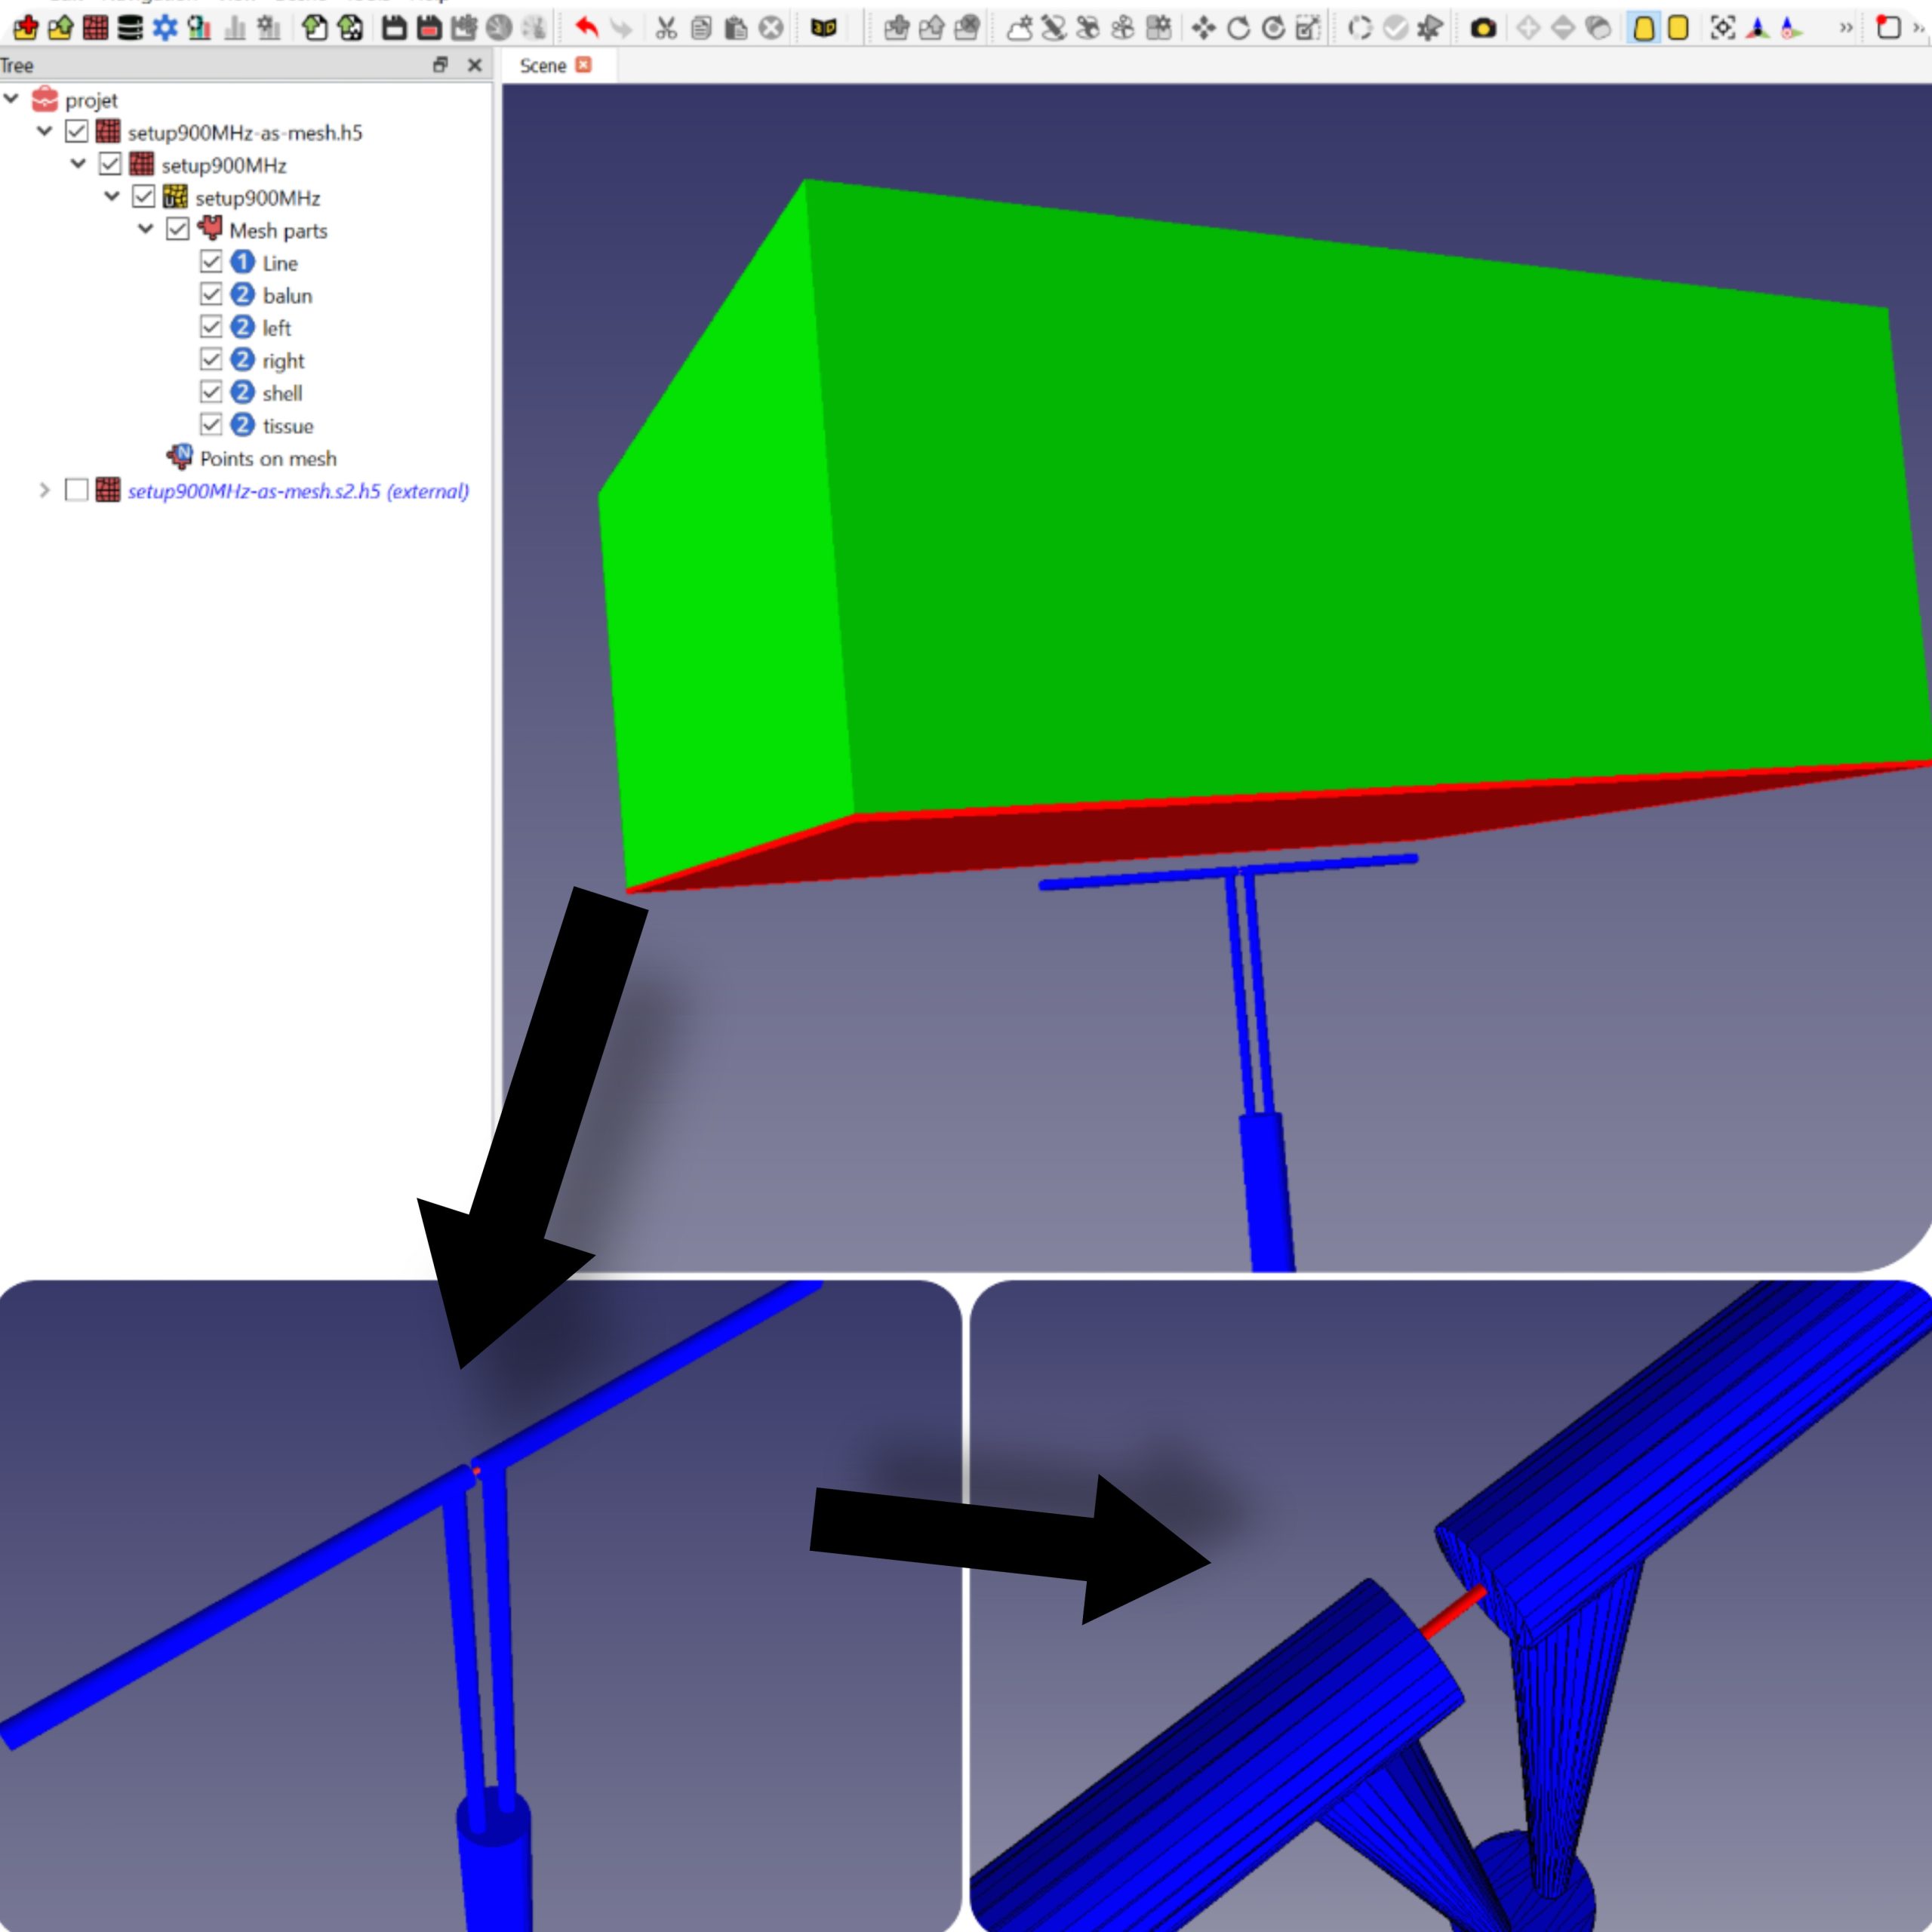
The dipole in blue, the phantom shell in red and the Tissue simulant in green are easy to notice. The tissue simulant and the phantom shell has the following physical characteristics.
f[MHz] |
Tissue simulant |
Phantom shell |
||
εr |
σ |
εr |
σ |
|
900 |
41,5 |
0,97 |
3,7 |
0 |
Through MaxSim, a non-uniform structured mesh is generated from the geometry.
This is a mesh for which the dimension of the meshes is not fixed throughout the grid; in the three dimensions independently, the step grid may not be constant while respecting progression constraints.
Several criteria make it possible to define the step grid of the system : the maximum frequency of the study, the geometric criteria of the CAD and the criteria linked to the physical properties of the materials of the model. This explains the fact that some areas are finely meshed and others caorsely.
Constraint marks (in yellow in the following figure) are placed in certain zones to take account of constraints when defining the mesh. The boundaries of the mesh space are the transparent planes just after the constraint marks. There are then free space cells before and after the mesh space.
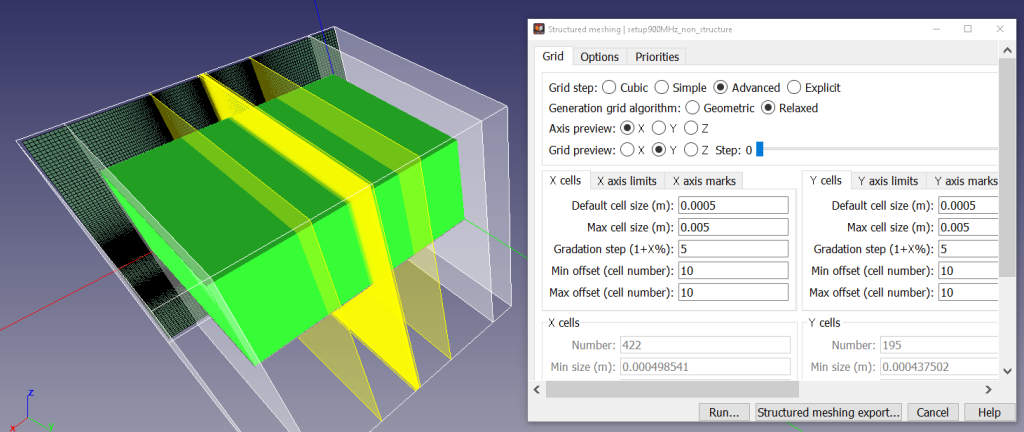 Figure 1: Constraint marks and limits of the mesh space
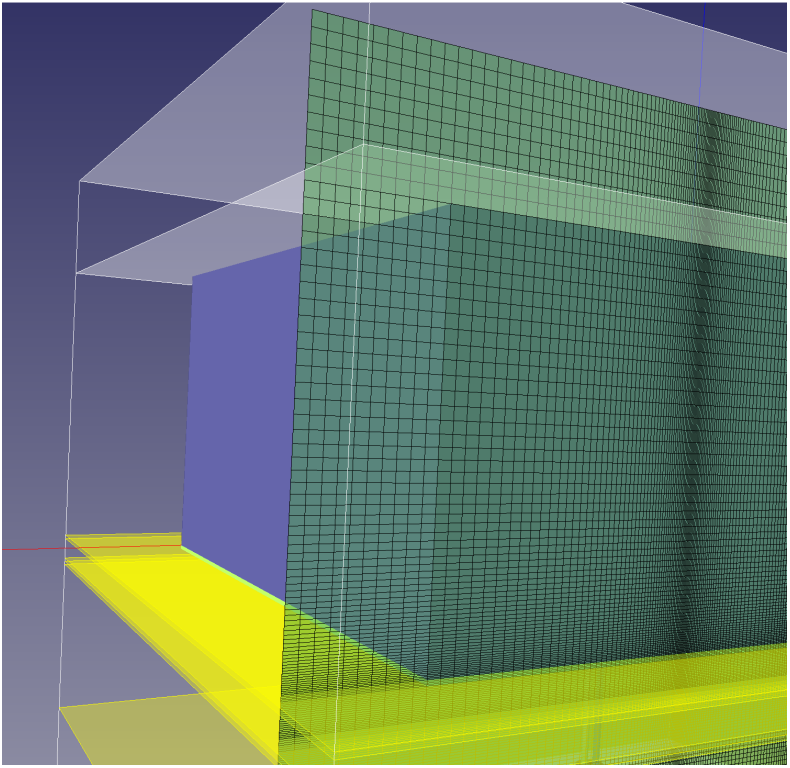
Figure 2: Constraints marks at the level of the phantom shell and the dielectric bloc
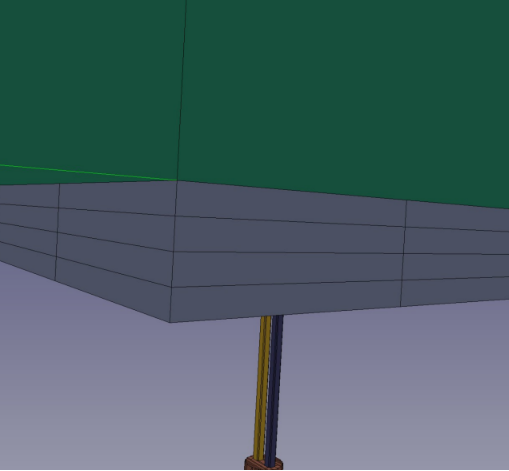
Figure 3: mesh of the thickness of the phantom shell (in grey)
Outputs requests:
-
-
-
The output requests are as follows:
-
Radiation patterns with and without the dielectric block at 900 MHz
-
SAR cartography
-
The input impedance of the generator at 900 MHz
-
The current and voltage of the generator at 900 MHzThe SAR of 1g of tissue and the SAR of 10g of tissue
-
-
Post-processing and Results
Before comparing the results obtained with the standard, we will first show the SAR for 1g of tissue and the radiation patterns with and without the dielectric block.
SAR 1g cartography
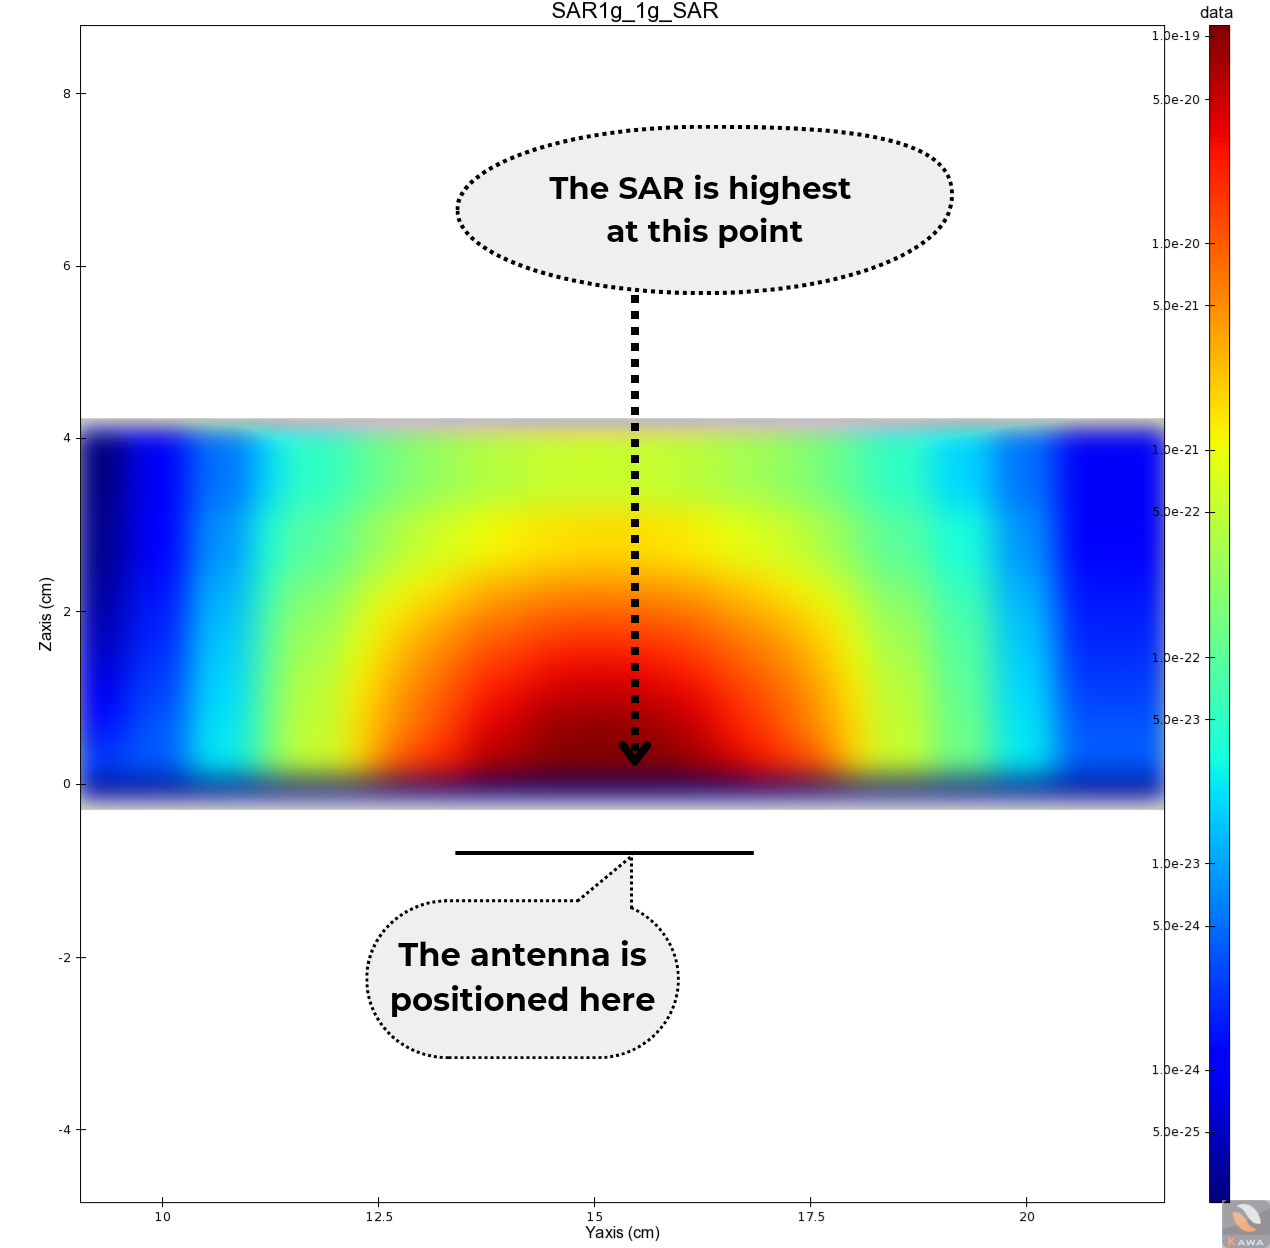
The maximum 900 MHz SAR is located in the lower part of the dielectric block. Energy is highest near the antenna, in the middle. This energy is absorbed quickly thanks to losses.
Radiation patterns of the dipole with and without the dielectric block
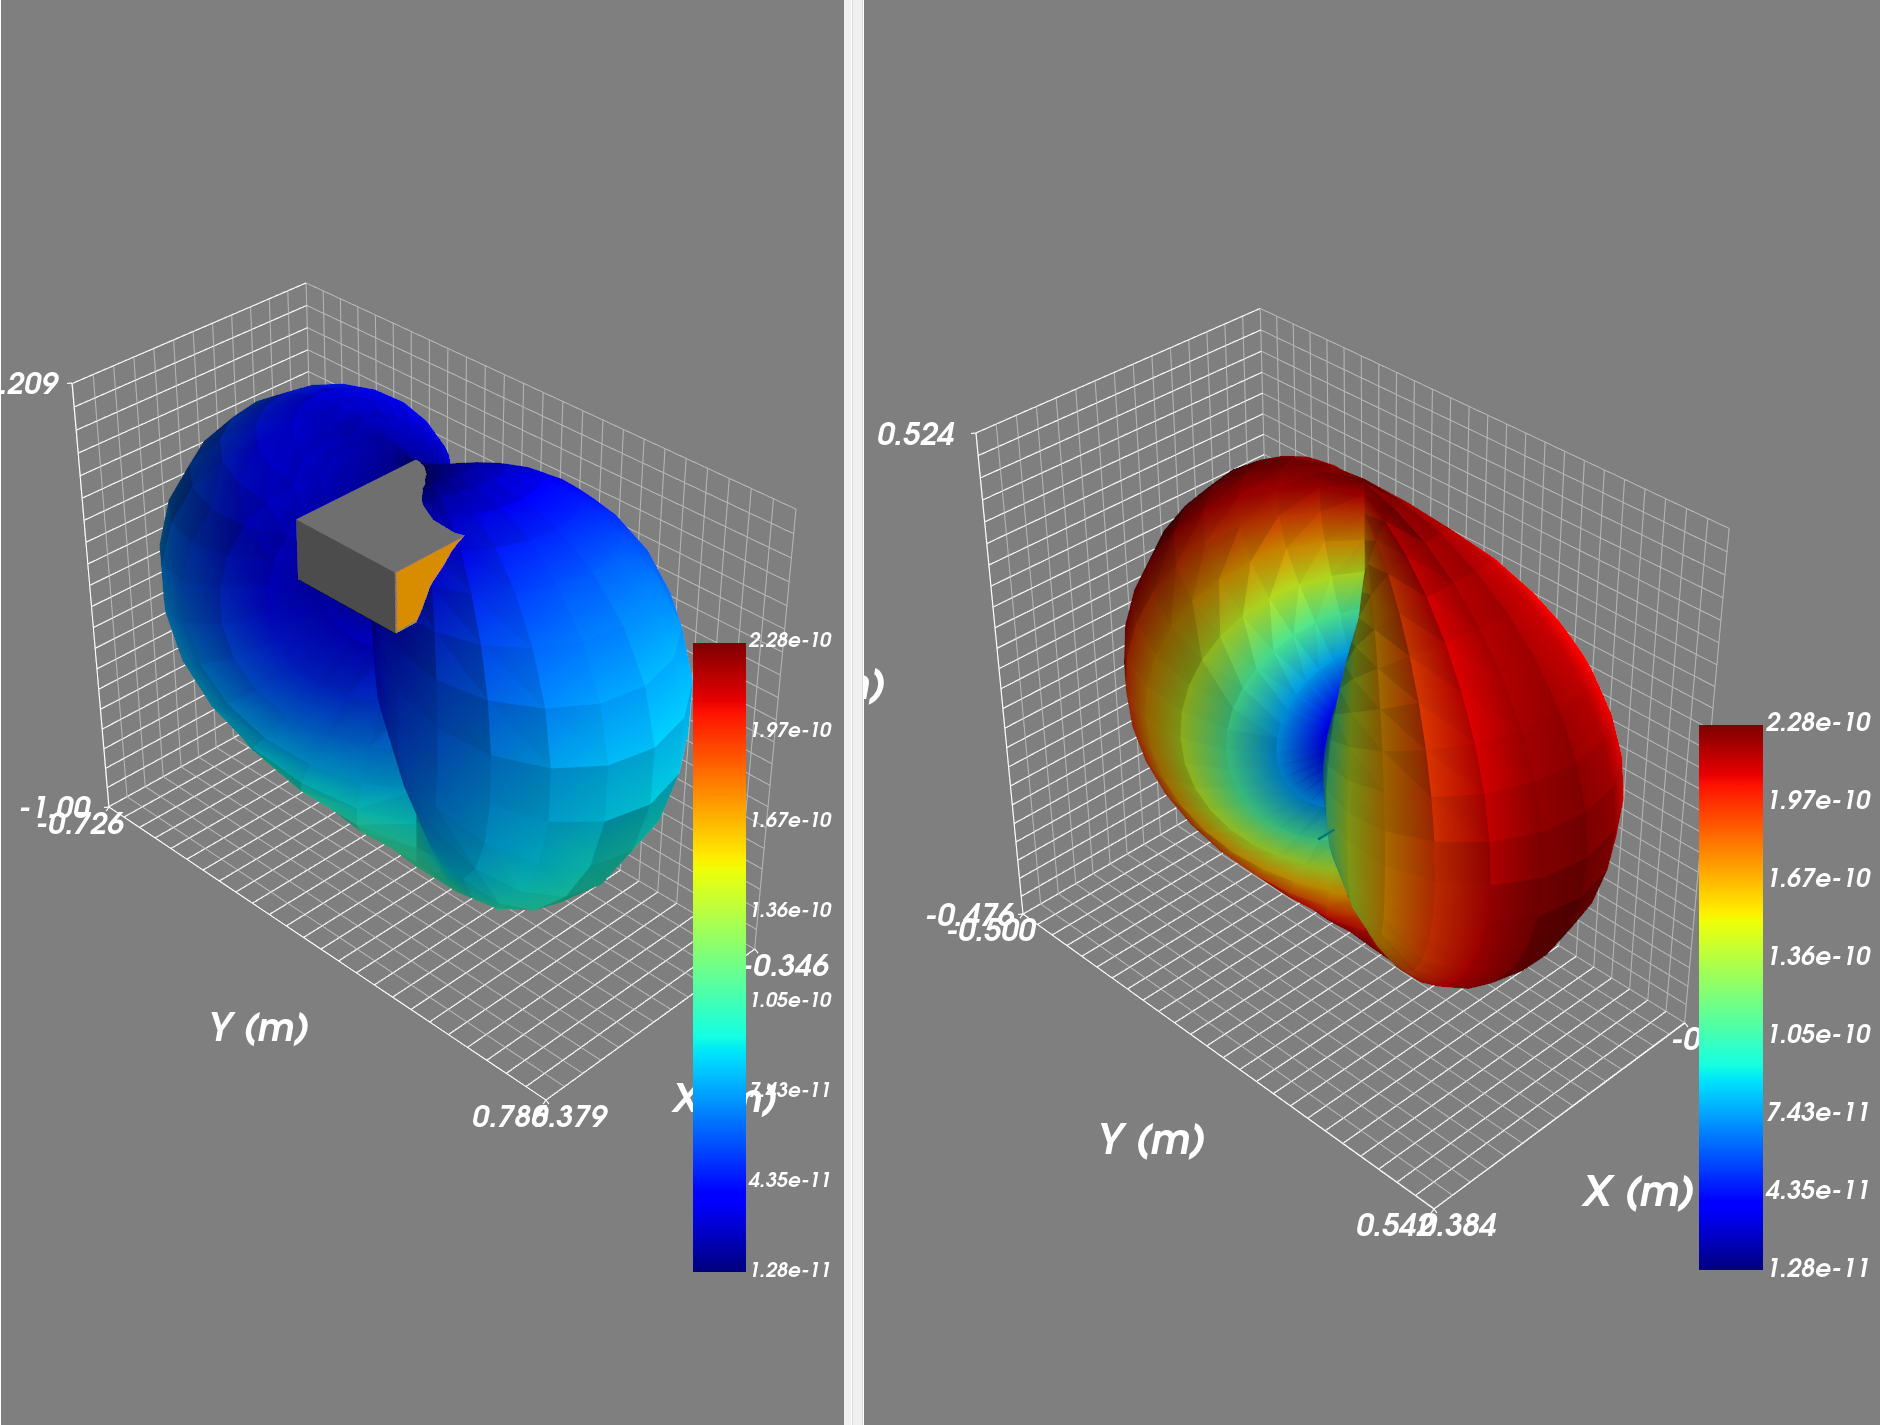
Here we will see how the radiation diagram is affected by the presence of the dielectric block.
If you look at the graph on the left, you can see that the energy radiated by the antenna is greater. The dipole radiates in all directions. And if we add the dielectric bloc (the image on the right), a large part of what is radiated is absorbed by this block.
Comparison chart
The allowed deviation for psSAR and the real part of the impedance is 10%. Furthermore, a drift of ± 5Ω is allowed for the imaginary part of the input impedance.
The results obtained after calculation for the non-uniform configuration are as follows :
| Outputs |
Results |
62704 Standard |
Deviation |
Awaited |
| 1g psSAR | 10.53 W/kg | 11 W/kg | 4.29 % | <10% |
| 10g psSAR | 6.77 W/kg | 7.07 W/kg | 4.23 % | <10% |
| Impedance | 49.49+6.77j | 49.9+2.3j | ||
| Re(Z) | 49.49 Ω | 49.9 Ω | 0.8 % | <10% |
| Im(Z) | 6.772 Ω | 2.3 Ω | 4.47 Ω | <5Ω |


You must be logged in to post a comment.